Dashboards are a simple way to visualise collected market data. They can be adjusted to your requirements, exported to Power Point or sent as a PDF at any time.
Why are dashboards used so frequently?
- They show real time data
- They help to measure your targets
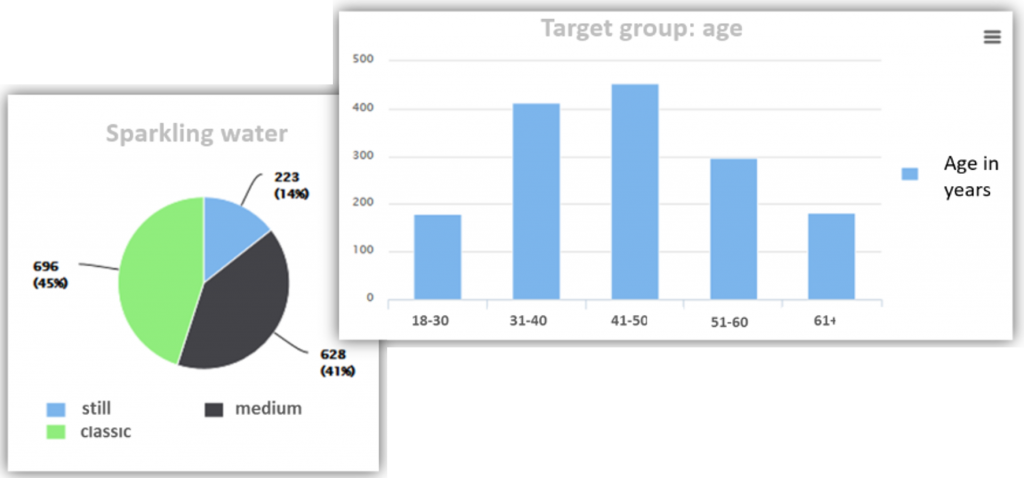
- They can be configured in different graphic formats
- Our mobile version is optimised for tablets
“Create dashboards and receive information from the first moment.”
Dashboards provide performance and target achievement measurement and thus make your reasoning more convincing and simplify decision making.